
This year for the first time, the U.S. Census Bureau’s America’s Families and Living Arrangements table package includes estimates of same-sex couples.
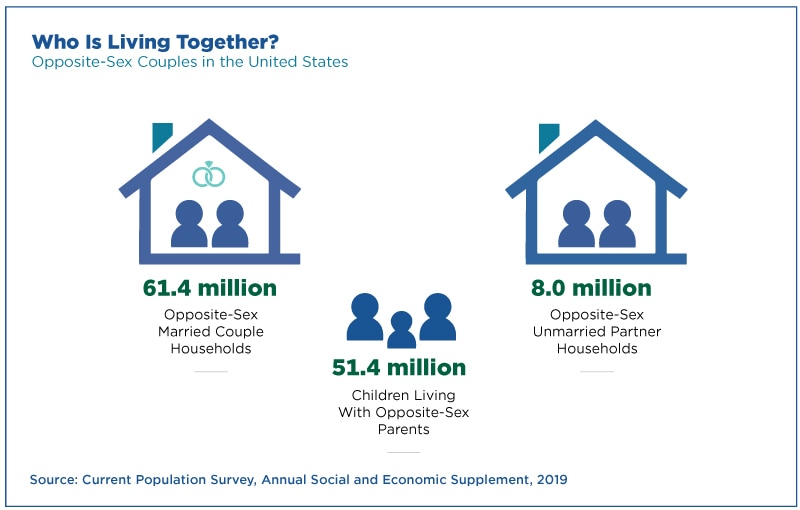
The new tables show there are 543,000 same-sex married households and 469,000 same-sex unmarried partner or cohabiting households. That’s a small number compared to the 61.4 million opposite-sex married and eight million opposite-sex unmarried partner households.
In addition, there are 191,000 children living with two same-sex parents.

The annual release of the table package, which comes from the Current Population Survey’s Annual Social and Economic Supplement, details the most recent characteristics of families, households and the living arrangements of adults and children in the United States.
Traditional images of family often are of a husband and wife with their biological children, but America’s families are much more diverse than that.
Improving the Current Population Survey
Because same-sex couples represent a relatively small proportion of all coupled households, a mismark in a survey response by a very small proportion of the much larger opposite-sex groups may lead to an inflated estimate of same-sex couples.
This is what happened after the 2010 Census, when the Census Bureau discovered that a small percentage of opposite-sex couples were accidentally mismarking the sex they reported.
This type of reporting error has the largest effect on the estimates of same-sex married couples, but it also affects same-sex unmarried couples.
Over a two-year, phased-in period, the Census Bureau updated and added improved relationship questions on relationship to the Current Population Survey (CPS) that produced more accurate measures of same-sex couples.
The CPS now asks a revised relationship to householder question that gives respondents the option of selecting from four explicitly separates types of couples: opposite-sex spouse; same-sex spouse; opposite-sex unmarried partner; and same-sex unmarried partner.
Another change was to include gender-neutral parent identification questions that allow respondents to identify two mothers or two fathers in a household.
Parent identification questions have been included in the CPS since 1982, when the Census Bureau first asked respondents to identify a parent for each household member, if one was present in the household.
In 2007, the Census Bureau added another parent identification question asking household members to specify if their mother or father, if either, was present in the home. However, there was no option for respondents to report two mothers or two fathers.
To allow for same-sex parents, the CPS now asks gender-neutral parent identification questions. It simply asks if the household member has a parent present and, if so, if they have another parent present, allowing respondents to identify two mothers or two fathers.
Subsequently, the Census Bureau updated its processing systems to the point where it can now release same-sex estimates in its annual America’s Families and Living Arrangements table package.
The recently published “Updates to Collection and Editing of Household Relationship Measures in the Current Population Survey” details these changes.
More Diverse Families and Living Arrangements
Traditional images of family often are of a husband and wife with their biological children, but America’s families are much more diverse than that.
Same-sex families reflect growing diversity and living arrangements in the United States.
Adults are marrying at later ages, for example. The median age at first marriage is now 29.8 for men and 28.0 for women. In 1947, it was 23.7 for men and 20.5 for women.
Adults are also in other types of living arrangements.
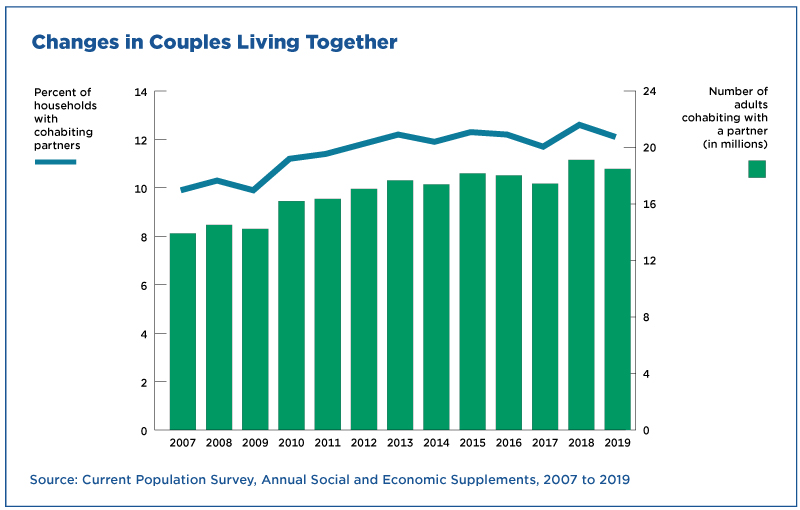
Unmarried partners living together, known as cohabitation, is increasing. Among adults ages 18 and over, 18.5 million (7%) are now cohabiting, up from 14.2 million (6%) in 2009.
Cohabiting couples now also make up a larger share of all coupled households: 12% compared to 10% in 2009.
Another example of diversity is the growing share of people living alone.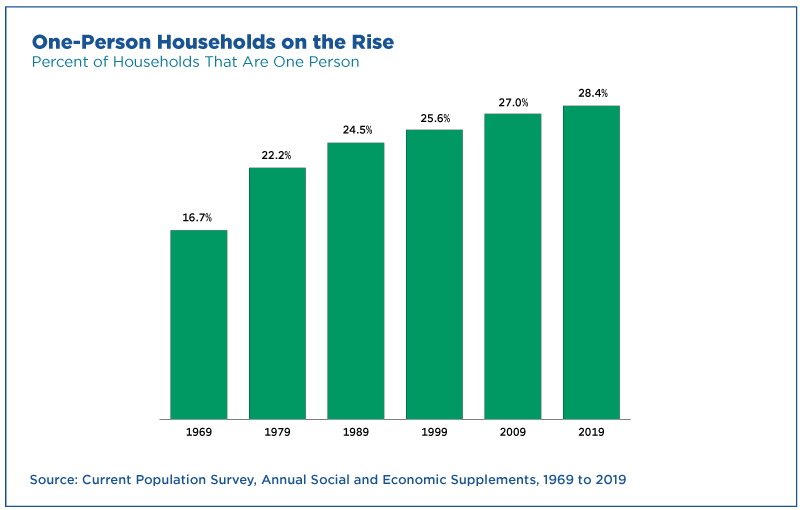
Other Highlights:
- The number of families living with their own children under 18 has declined in the last two decades. Now, 41% of all families live with their own children under 18, compared to 45% in 2009, and 48% in 1999.
- In 2019, 32% of all adults age 15 and over have never been married, up from 23% in 1950.
- Over a quarter (26%) of children under the age of 15 who live in married-couple families have a stay-at-home mother, compared to only 1% with a stay-at-home father.
- Over half (54%) of young adults ages 18 to 24 live in their parental home, compared to 16% of young adults ages 25 to 34.
Benjamin Gurrentz and Tayelor Valerio are survey statisticians in the Census Bureau’s Fertility and Family Statistics Branch.
You Might Also Like


