
The concept of poverty is often interpreted as a state of being “poor” or “not poor.” However, identifying one population as “poor” and everyone else as “not poor” oversimplifies the economic circumstances individuals and families face over the year.
In September, the U.S. Census Bureau will report the poverty rate for the United States. In a single statistic, the government, service providers and the public will know what percentage of the population was living below the poverty line in the prior year. However, one way to get a more detailed understanding of how well individuals and families are able to meet their economic needs is by using a measure referred to as an income-to-poverty ratio. Unlike the poverty rate, which reports the proportion of the population living below the poverty level, income-to-poverty ratios gauge how close an individual’s or family’s income is to their poverty threshold.
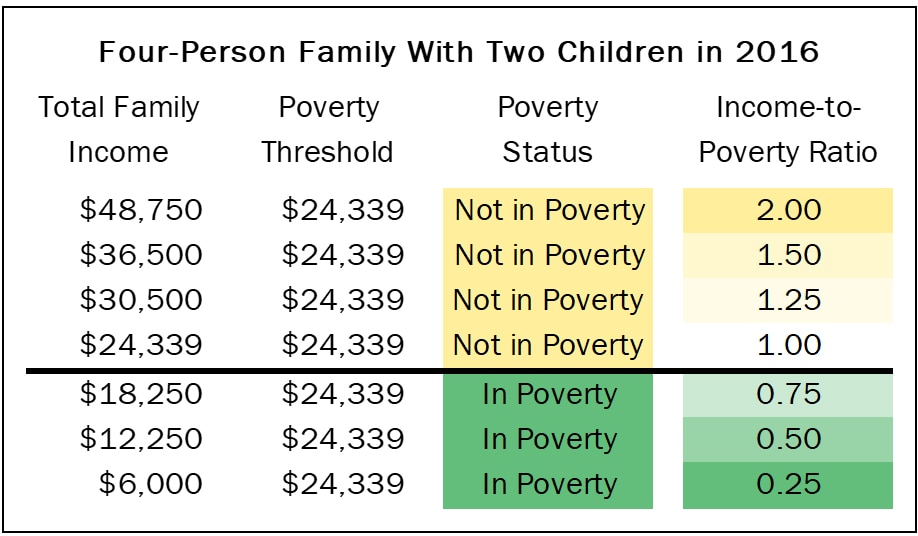
To give an example, in 2016 the poverty threshold for a four-person family with two children was $24,339. If that family had income totaling $12,250 for the year, they would be counted as being in poverty since their total income was less than their poverty threshold. Their income-to-poverty ratio would be calculated as $12,250 divided by $24,339 resulting in an income-to-poverty ratio of 0.50. These values may be shown as ratios, such as 0.50, or converted to a percentage (e.g., 50%). When an individual’s or family’s income is less than their threshold, their income-to-poverty ratio is less than 1, with ratios nearer to 1 indicating they are closer to meeting their economic needs. Individuals and families with incomes meeting or exceeding their threshold have income-to-poverty ratios equal to (income is exactly equal to the poverty threshold) or greater than 1, with values greater than 1 representing income that further exceeds the poverty threshold.
The table below provides examples at various income-to-poverty ratios for a family of four with two children in 2016, illustrating that while a family making $18,250 and one making $6,000 a year would both be considered to be in poverty, income-to-poverty ratios provide a more precise understanding of their economic circumstances.
In 2015, 13.5% of the population lived in poverty with income-to-poverty ratios below 1 (100% of their poverty threshold). A smaller proportion of the population, 6.1%, had income-to-poverty ratios below 0.5, meaning their family received less than half of the income necessary to meet their poverty threshold. An additional 18.1% of people in 2015 were not considered to be in poverty, but had incomes that were less than two times their poverty threshold, while the remaining 68.3% of the population had family incomes totaling two or more times their poverty threshold. Of the population that experienced poverty in 2015, nearly half (45.1%) had income-to-poverty ratios below 0.5.

The bottom line: When this report is released, it’s relevant to consider not just the proportion of people who are in poverty — but how people are distributed across various income-to-poverty ratios.