Decline in Share of People Without Health Insurance Driven by Increase in Public Coverage in 36 States
Written by: Douglas Conway and Laryssa Mykyta
During the past two years, Congress passed measures to improve access to public and private health insurance coverage during the COVID-19 Public Health Emergency including continuing coverage for people receiving Medicaid and introducing policies to help people access and afford the cost of care.
These and other federal and state policies contributed to an increase in public coverage in 36 states, leading to lower uninsured rates in 28 states in 2021. Only one state – North Dakota – had a higher uninsured rate in 2021 than in 2019, according to the Census Bureau’s 2021 American Community Survey (ACS) 1-year estimates.
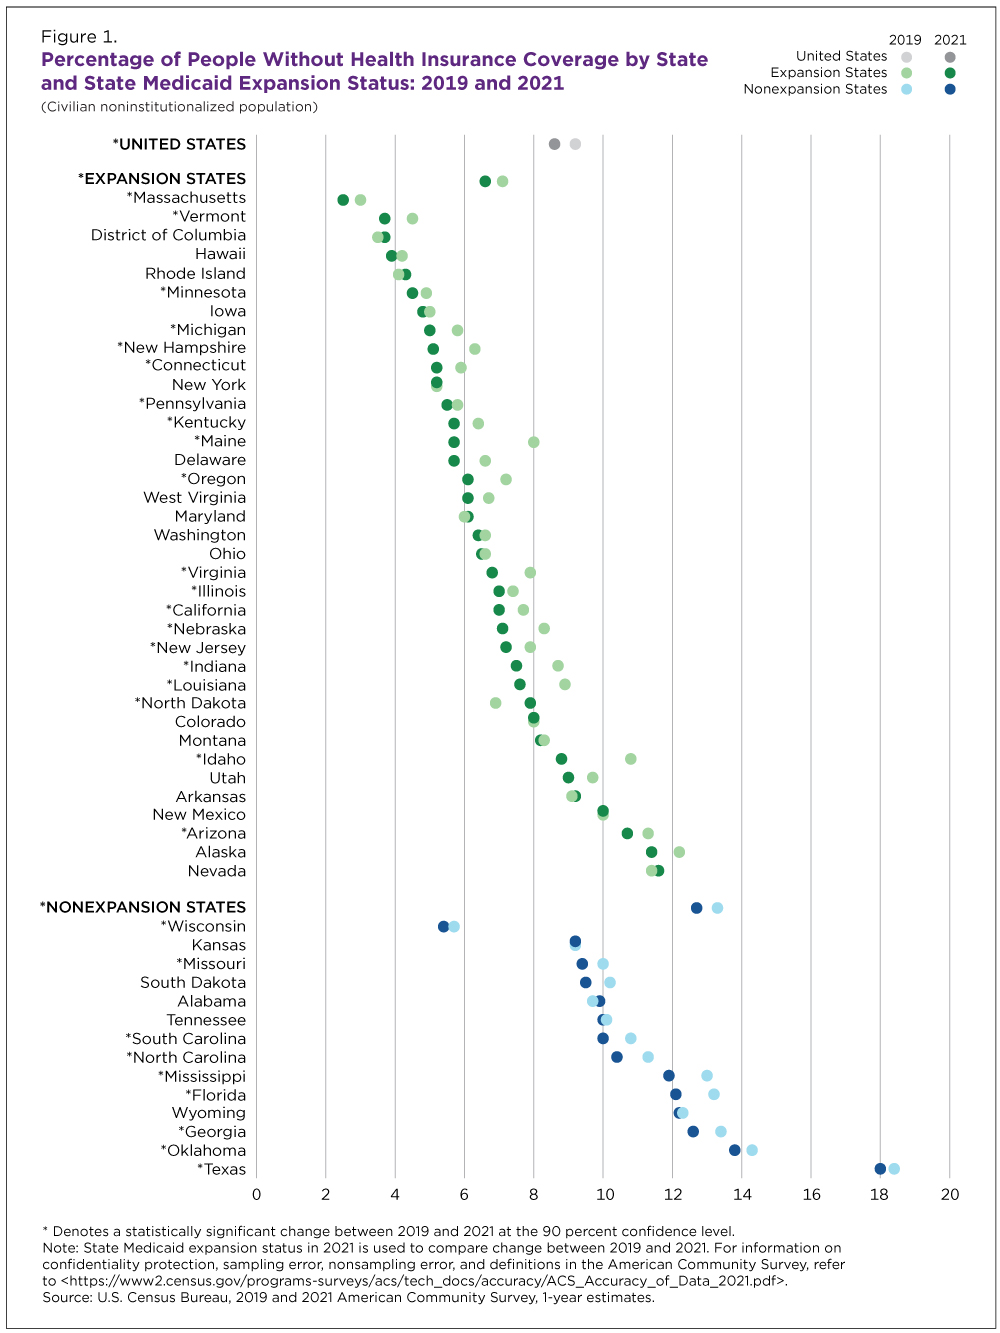
In 2021, the uninsured rate ranged from 2.5% in Massachusetts to 18.0% in Texas.
The large sample size of the ACS shows health insurance rates and types of coverage in the 50 states and the District of Columbia, including private coverage (employer-sponsored, direct-purchase and TRICARE), public coverage (Medicare, Medicaid, CHAMPVA and VACARE), and the overall uninsured rate at the state level.
Changes in health insurance coverage across states may be affected by a variety of factors like differences in the age of the population, economic conditions and federal and state policy changes. Understanding these differences may help inform policies to improve health and well-being.
State Differences in the Uninsured Rate in 2021
In 2021, the uninsured rate ranged from 2.5% in Massachusetts to 18.0% in Texas (Figure 1).
Health insurance coverage rates may be related to whether a state expanded Medicaid eligibility to lower-income families under the Patient Protection and Affordable Care Act (ACA). Thirty-six states and the District of Columbia expanded Medicaid eligibility on or before January 1, 2021 (“expansion states”), and 14 states did not (“nonexpansion states”).
In 2021, the uninsured rate was 6.6% in expansion states and 12.7% in nonexpansion states. (Figure 1). Five states with uninsured rates of 12% or more (Florida, Georgia, Oklahoma, Texas and Wyoming) had not expanded Medicaid eligibility.
Between 2019 and 2021, the share of uninsured people fell 0.5 percentage points. Among states with the largest drops: Idaho (2.0 percentage points), and Maine (2.3 percentage points). Declines in those two states were not statistically different from each other. Notably, Idaho and Maine both expanded Medicaid eligibility in 2020.
Private Health Insurance Coverage
People may have private coverage through their own or a family member’s employer, by purchasing coverage directly or through the TRICARE, a health care program for uniformed service members, retirees and their families.
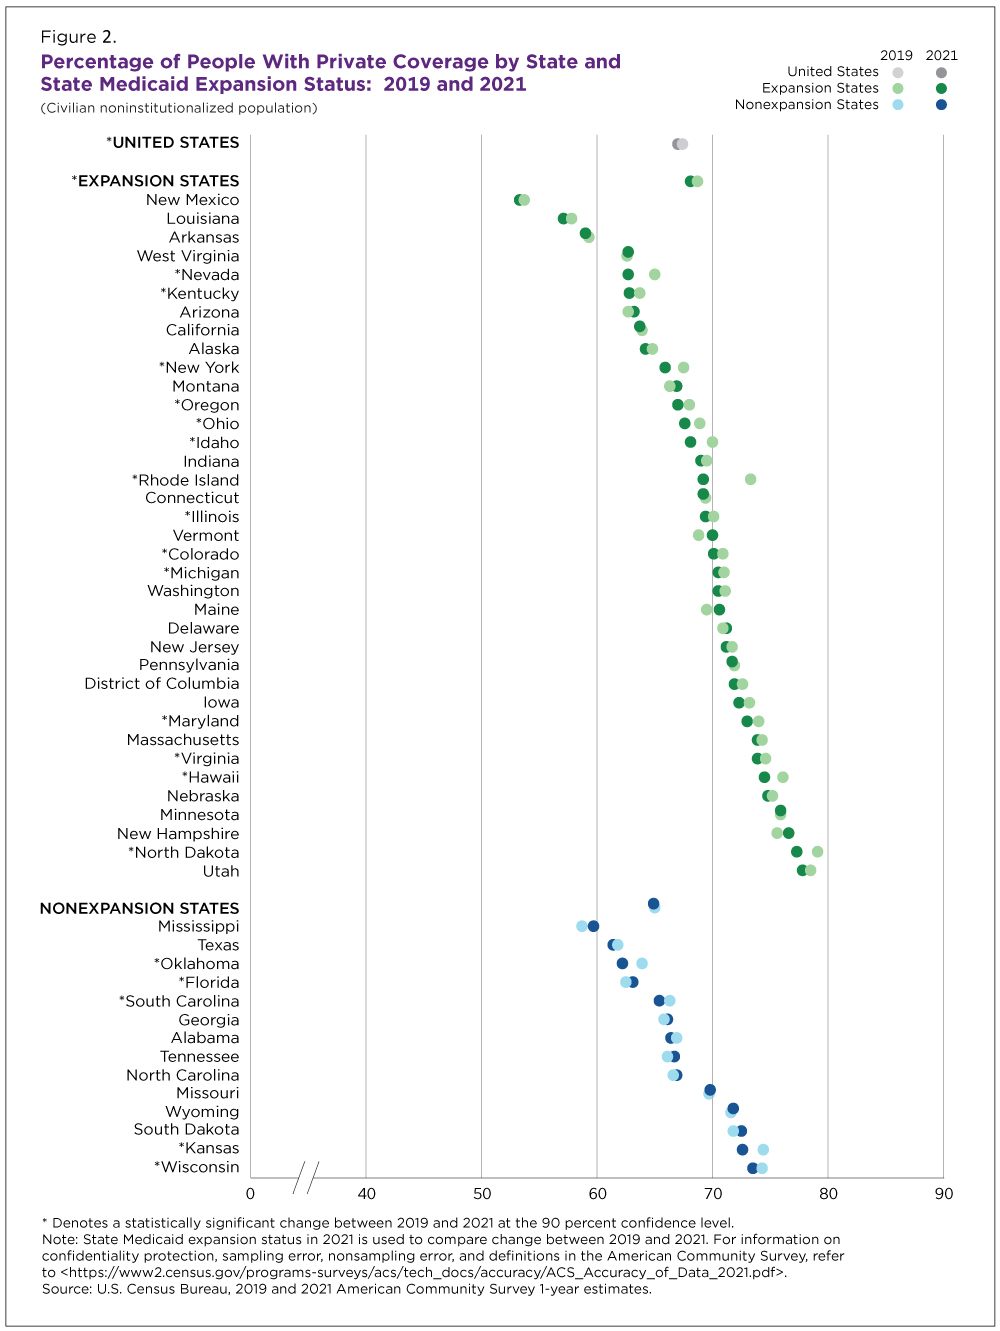
Private coverage rates ranged from 53.3% in New Mexico to 77.8% in Utah (Utah’s private coverage rate was not statistically different from North Dakota’s at 77.3%).
Among the states with the highest private coverage rates in 2021: Minnesota (75.9%), New Hampshire (76.6%), North Dakota (77.3%) and Utah (77.8%) (Figure 2). The rate in New Hampshire was not statistically different from the rates in Minnesota and North Dakota.
These states also had higher rates of employer-sponsored coverage than the national average of 54.7%. High rates of employer-sponsored coverage reflect strong economic conditions. According to the Bureau of Labor Statistics, these states also had lower unemployment rates in 2021 than the national average of 5.3%: Minnesota (3.4%); New Hampshire (3.5%); North Dakota (3.7%); and Utah (2.7%).
Between 2019 and 2021, private coverage rates decreased by 0.4 percentage points nationally.
States that experienced high unemployment also experienced sizable drops in private coverage, although these declines were not statistically different: Nevada (down 2.3 percentage points) and Rhode Island (down 4.2 percentage points) (Figure 2). Both states experienced increases in unemployment rates between 2019 and 2021 that may have contributed to the decline in private coverage.
Private coverage rates decreased in 18 states and only one state — Florida — saw an increase in private coverage driven by a 1.5 percentage point increase in direct-purchase coverage. According to the Centers for Medicaid and Medicare Services (CMS), ACA Marketplace enrollment increased in Florida during this period. Marketplace coverage is a type of direct purchase coverage.
Public Health Insurance Coverage
People may have public coverage through the Medicare program that provides coverage to people ages 65 and older, the Medicaid program which provides coverage to those with low incomes or a disability or through the Veterans Administration (VA Care or CHAMPVA).
Overall, public coverage rates increased by 1.4 percentage points to 36.8% between 2019 and 2021. Public health coverage rates went up in 36 states but did not decline in any during this period.
The increase in public coverage was driven in part by a 1.3 percentage point increase in Medicaid coverage, consistent with an increase in enrollment in 2020 and 2021 reported by the Centers for Medicare and Medicaid Services.
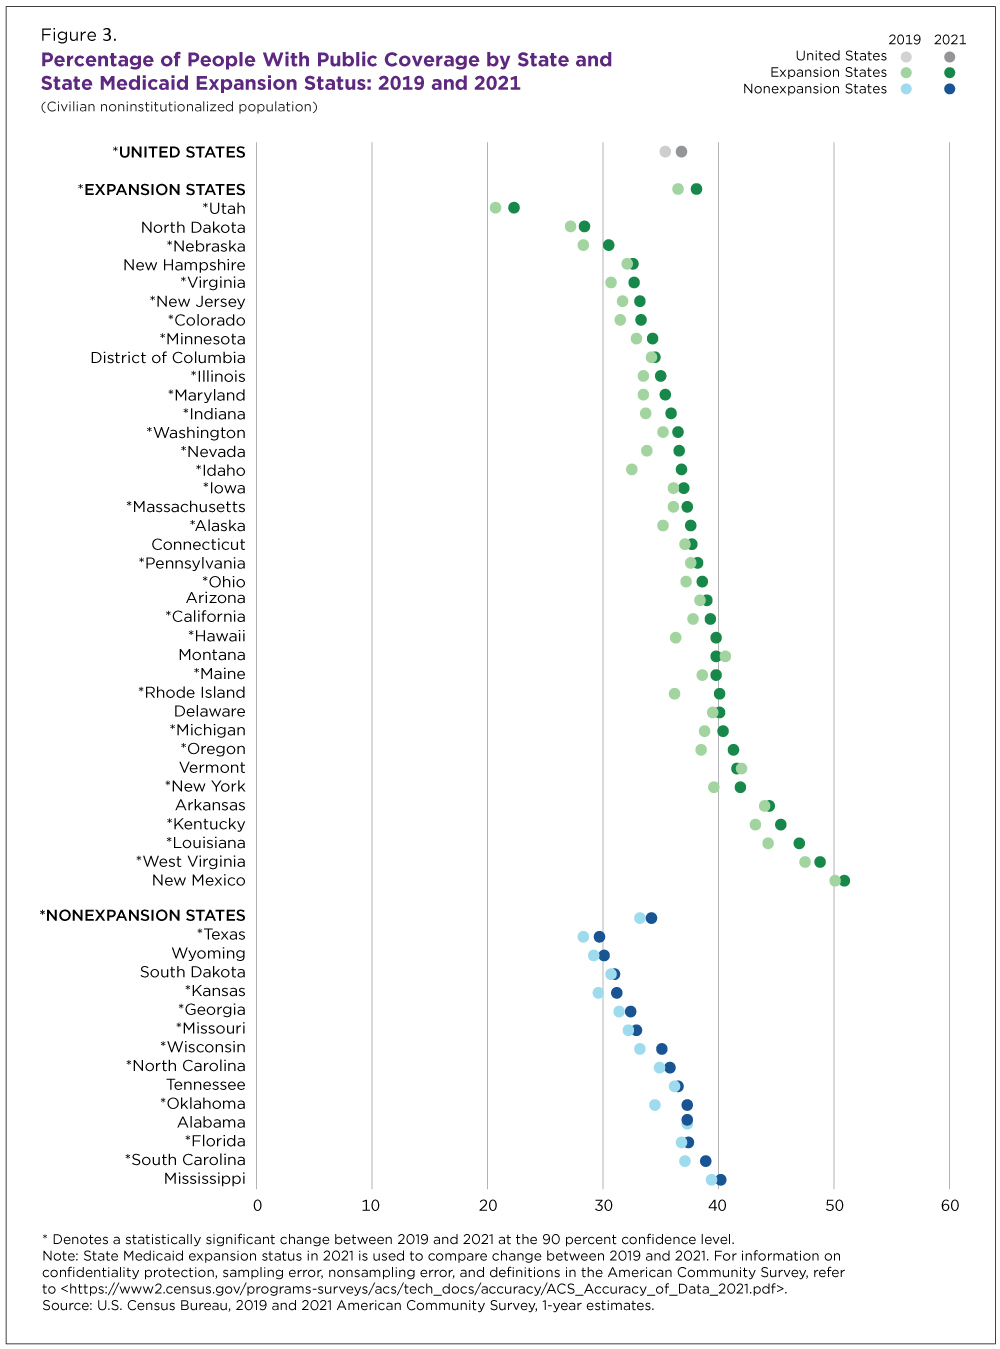
In 2021, Utah had the lowest rate of public coverage (22.3%) and New Mexico’s public coverage rate (50.9%) was the highest across states and the District of Columbia (Figure 3).
In New Mexico, about one-third of people were covered through Medicaid, contributing to its high public coverage rate. In contrast, 11.3% of people in Utah were covered by Medicaid.
Medicaid Expansion and Public Coverage
In 2021, public coverage rates were higher in expansion states (38.1%) than in nonexpansion states (34.2%); 22.7% of people in expansion states and 18.0% in nonexpansion states had Medicaid.
Expansion states saw a larger increase (1.6 percentage points) than nonexpansion states (1.1 percentage points) in public coverage (Figure 3).
The increase in Medicaid coverage rates was also higher in expansion states (1.5 percentage points) than in nonexpansion states (0.9 percentage points).
Laryssa Mykyta is branch chief and Douglas Conway is a survey statistician in the Census Bureau’s Health and Disability Statistics Branch.
